R code used for each of the graphics is available here.
While flipping through an issue of the Economist a few years ago, I stumbled across an article summarizing UFO sightings reported across the US. It wasn’t a full feature, but the topic was playful and I lingered on it longer than I spent with the rest of the issue. The author had put together a map charting sightings by state, and a plot looking at how sightings were distributed across the day. Their conclusions were pretty straightforward:
sightings are more likely to be rural, “shunning” big cities due to light pollution
sightings are most likely to occur
- when people aren’t working
- when people are likely to be drinking
For a short blurb, these takeaways are tidy, but for a piece titled “Everything you need to know about UFOs”, I wanted more to chew on. How much is alcohol really implicated in sightings of this kind? What about other local factors? These felt like glaring questions, but my musing was shelved when I closed the magazine. Luckily, Kaggle posted an updated version of the dataset to download, and after finding it, I couldn’t wait to look at some of these questions closer.
Each row in the data is an individually reported sighting, archived by the National UFO Research Center in Washingon (NUFORC). Over 80,000 events are recorded, going all the way back to the early 1900s. In addition to listing the date/time that a sighting was reported, the shape of the object, city, state, country, and latitude/longitude coordinates are all recorded. Most of the reports are from the US (79%), so I decided to keep my focus there.
the number of sightings reported is increasing
As far as I know, national excitement about UFOs was strongest during the Cold war. Project Blue Book was set up by the US Airforce in the 50s, and aimed to collect evidence and explain different sightings being reported. It was ultimately shut down due to inconclusive findings. I expected to see more documented sightings between the 50s-70s, but this definitely isn’t reflected in the file. This is a good point to consider the limitations of what we’re working with. NUFORC was started in 1974, so perhaps it’s surprising they’ve taken the time to record anything earlier than that at all. Someone would have to be pretty motivated to call-in about an experience they had years after it happened. Second, even closer to the present, it seems safe to say that NUFORC’s data doesn’t capture all the events that might be called sightings on an annual basis.
That said, the number of sightings in each state has seen a steady climb since 2000. My guess is that due to prominence of search engines, awareness of NUFORC (and thus, the likelihood of reporting) has increased. You can follow the trend with the boxplots below. Each state contributes their count for a given year, and the boxplot helps give a sense how much they vary from each other.
(The outliers from each year reliably include a handful of states from the west, like Washington and California.)
what people report seeing
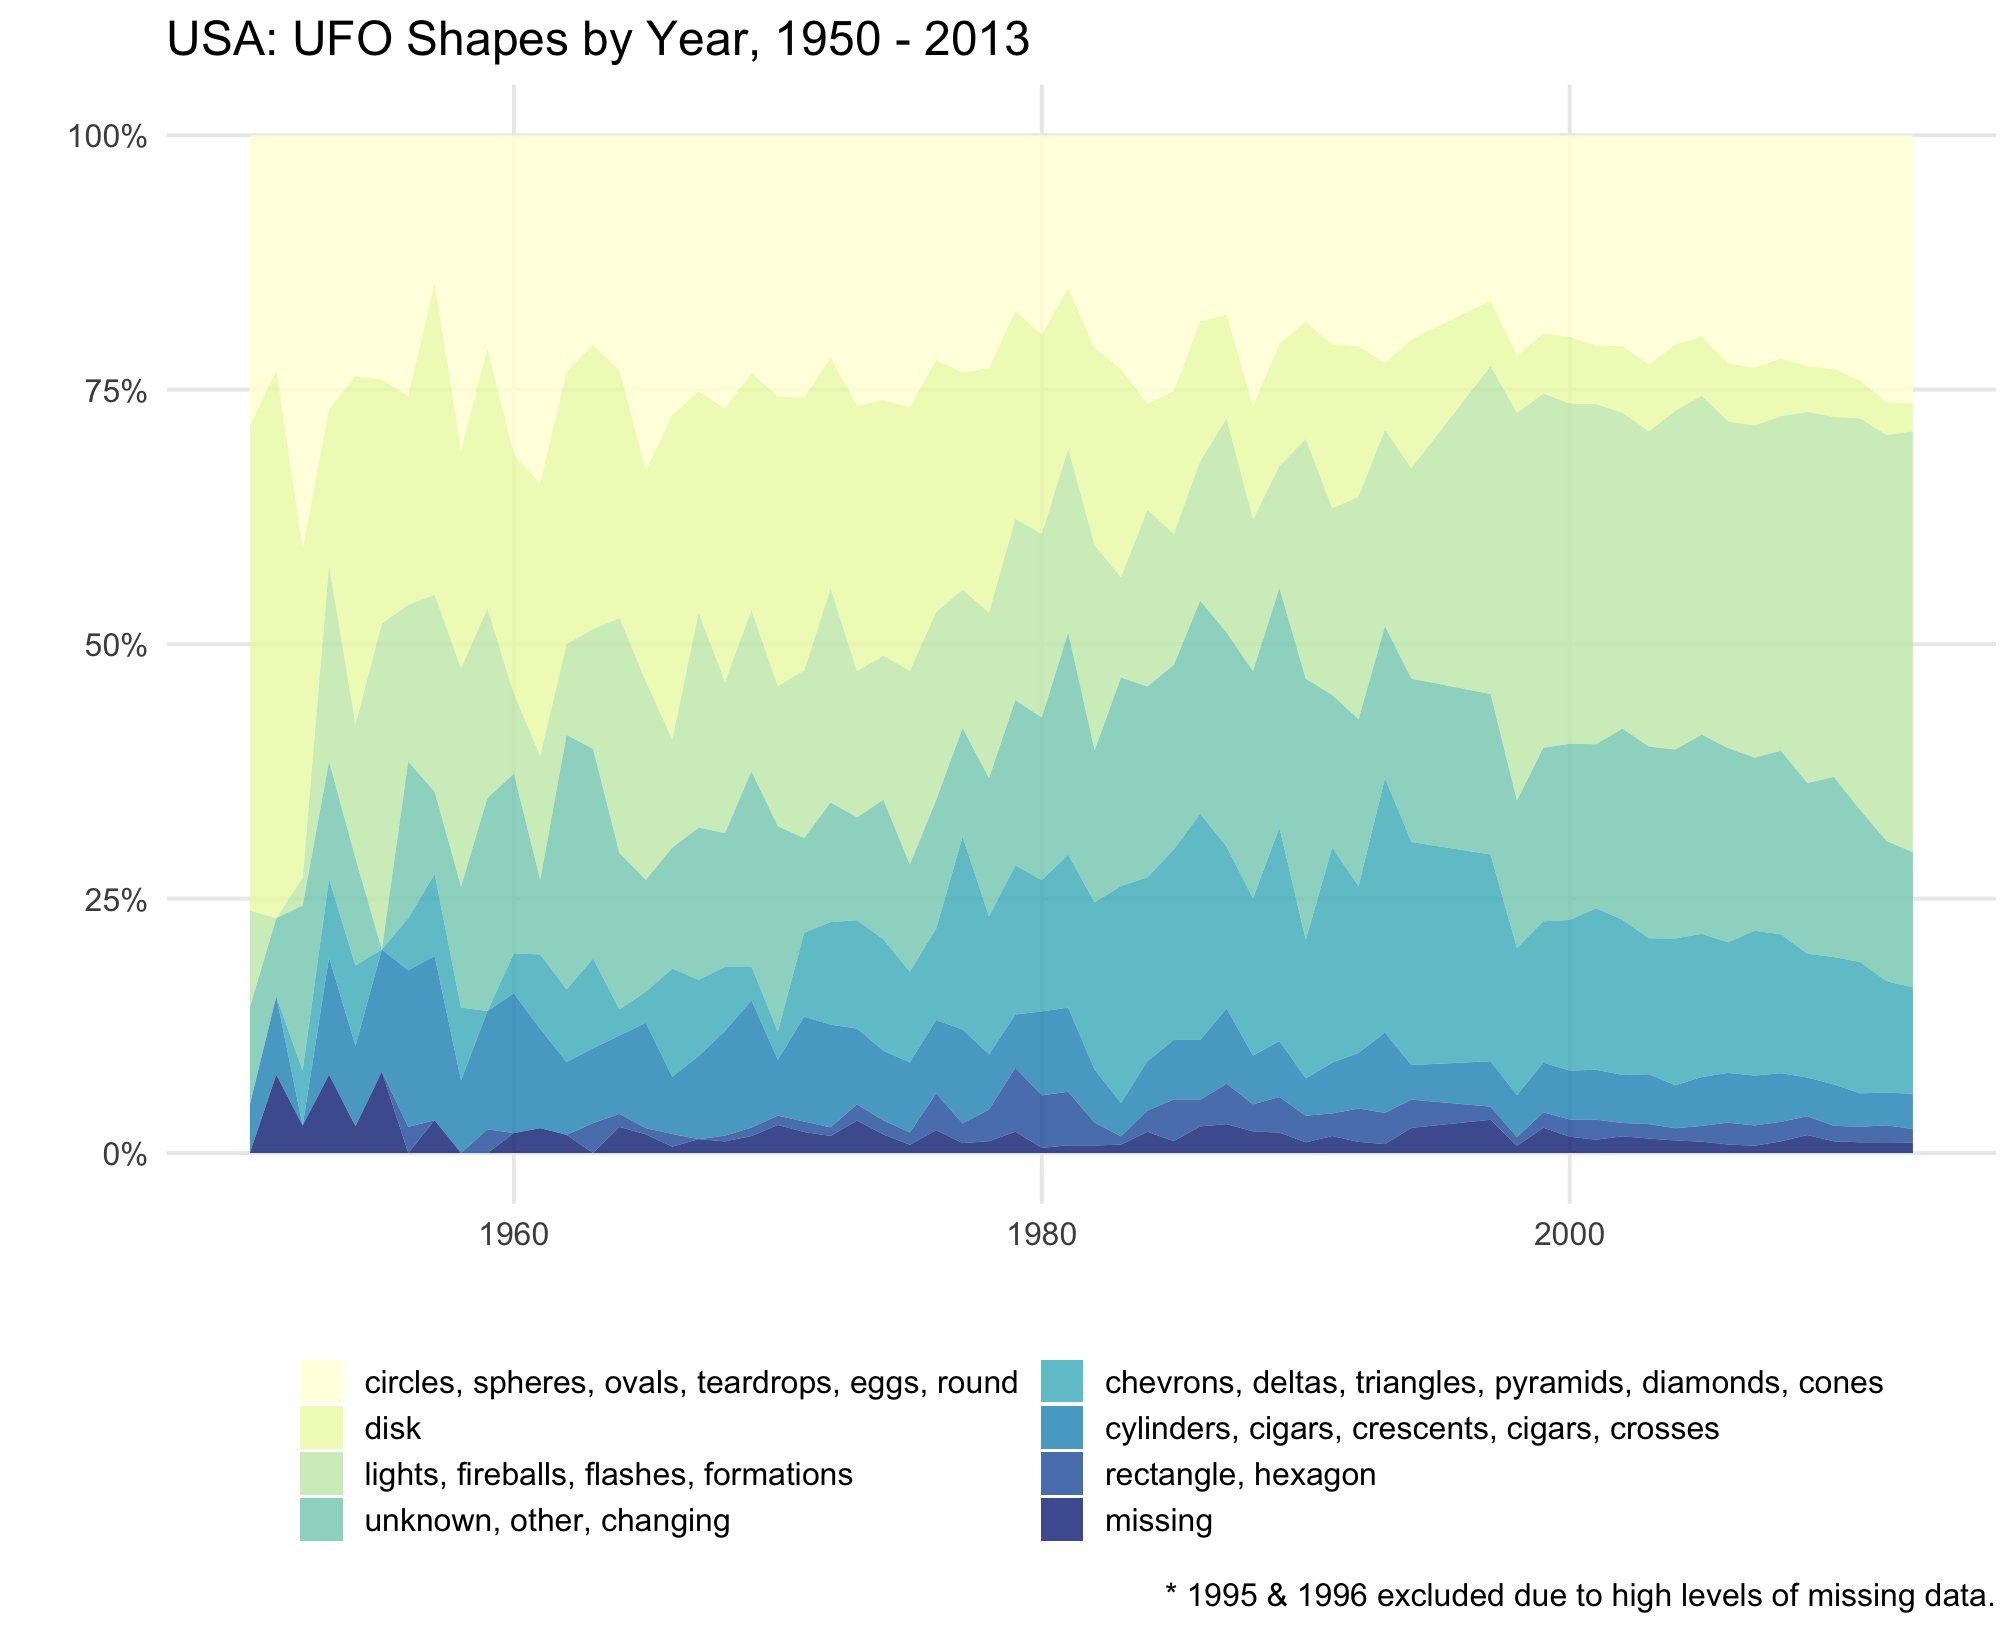
One of the things I was most curious about that went unmentioned in the Economist piece was what people say they’re seeing! The next chart looks at the composition of all US sightings reported during each year. The thicker the color band, the higher the percentage of a year’s sightings can be attributed to a set of shapes. Across the whole time span, the most common kind of UFO are lights (maybe looking something like this?), but this wasn’t always the case. Earlier sightings were much more likely to report the classic saucer/disk shape. The fact that we don’t have as many reports from the 60s and 70s is a little disappointing. Because we’re simply seeing thousands more sightings in recent years, it’s hard to say why the disk shape has fallen out of favor. Air travel has also become increasingly ubiquitous since the 70s, so perhaps the increasing share of “lights” sightings can be attributed to that.
seasonal differences
Next, I wanted to know whether there’s a particular “season” for spotting UFOs. To get there, I created a rate of sightings per million people in the US population. This is a point where we can get a grip on just how rare sightings are, per-person– even in 2013 we’re only seeing 1-2 sightings each month per million people. You can see sightings become more common as we move toward the present, but there are also defined portions of the year that people are most likely to report sightings– namely during the summer and fall. This lines up with what the Economist reported (i.e. sightings happen most frequently during evenings and weekends), given that these parts of the year tend to be when people spend the most time outside.
where are sightings most likely to happen?
As I mentioned above, the Economist piece suggests that sightings tend to spurn big cities, rationale being that light pollution drives down reports. They also suggested that sightings favor the US/Canada border, and other rural areas. I’m not sure if I’ve reached the same conclusions… The map below reflects two pieces of data for each county in the US during 2013: population density (people/km^2), and sightings reported. The little grid below reflects how I’ve categorized each county. The top-left (dark-grey) represents counties with a really high population density but low numbers of sightings. The bottom right (deep brown) represents counties with a low population density but really high sighting count. Up in the top right we have counties whose number of sightings tracks well with their population size.