The NYT has a fun interactive up this week, looking at audio features to see if popular summer songs have the same sort of “signature”. After attending a presentation earlier this year, I discovered that these same sorts of features are accessible through Spotify’s API! How people curate their collections and approach listening to music usually tells you something about them, and since seeing the presentation I’ve been wanting to take a dive into my own listening habits. After getting inspired by the NYT’s piece, I felt like I knew how I could get started. Plus, there’s an R package now on CRAN that serves as a wrapper for Spotify’s API, making the data collection process easy.
Spotify’s API functionality seems pretty straightforward. Tracks are curated as playlists by users, and tracks have a bunch of metadata (artist, album, etc.). Each of these entities (tracks, albums, artists, users) has an ID, allowing you to organize and jump between them. The first thing I need are all the tracks from each playlist I’ve created. Once I have them, it’s just one more line of code to get the audio features that Spotify makes available.
library(tidyverse)
library(spotifyr)

# fetch the public playlists/tracks & features from my account
my_lists  <- get_user_playlists("amateurthoughts")
my_tracks <- get_playlist_tracks(my_lists)
audiofeat <- get_track_audio_features(my_tracks)

feats <- my_tracks %>%
  select(playlist_name, track_name, artist_name, track_uri) %>%
  left_join(audiofeat, by = "track_uri")
Since I started using Spotify actively around 3 years ago, I’ve been creating a new playlist for each month. I’m interested in comparing my most recent listening habits to what I was doing last year. So, I’ll pull out all the tracks up through August of this year, and grab the corresponding playlists from 2017. I’ve named them in the same way each time: “January ’18”, “February ’18”, etc. This should make working with the features I collected a little easier.
feats <- feats %>%
  filter(str_detect(playlist_name, "'")) %>%
  separate(playlist_name, into = c("month", "year"), sep = " '") %>%
  mutate(month = str_trim(month))

# pluck out only the months we've run through in 2018
feats <- feats %>%
  filter(
    year %in% c(17, 18),
    !month %in% c("September", "October", "November", "December")
  )

feats$month <- factor(feats$month, levels = month.name[1:8], labels = month.abb[1:8])
Now we have a little dataset with a row for each track. Each month, I get up to about 151 minutes, which is around 40.5 songs. Let’s see what Spotify has available for us to look at.
glimpse(feats)## Observations: 595
## Variables: 19
## $ month <fct> Aug, Aug, Aug, Aug, Aug, Aug, Aug, Aug, Aug, Au…
## $ year <chr> "18", "18", "18", "18", "18", "18", "18", "18",…
## $ track_name <chr> "Goodnight Moon", "Lullaby", "Imaginary Folklor…
## $ artist_name <chr> "Boogie Belgique", "Proleter", "clammbon", "Tyc…
## $ track_uri <chr> "2rvo9Ddv18aRV0OJldhWTf", "4eQKQ5ZO4UlSUzskVqFU…
## $ danceability <dbl> 0.788, 0.893, 0.602, 0.689, 0.250, 0.488, 0.480…
## $ energy <dbl> 0.675, 0.582, 0.792, 0.642, 0.288, 0.872, 0.520…
## $ key <chr> "G", "G#", "D", "E", "C", "A", "D#", "D", "D", …
## $ loudness <dbl> -8.591, -8.087, -8.463, -11.697, -14.341, -7.64…
## $ mode <chr> "minor", "major", "major", "minor", "major", "m…
## $ speechiness <dbl> 0.0318, 0.1500, 0.0331, 0.0450, 0.0323, 0.0340,…
## $ acousticness <dbl> 6.16e-02, 2.00e-01, 1.46e-01, 2.92e-01, 6.93e-0…
## $ instrumentalness <dbl> 7.11e-01, 2.48e-02, 8.87e-01, 8.70e-01, 8.24e-0…
## $ liveness <dbl> 0.1000, 0.0749, 0.1180, 0.1730, 0.1020, 0.0885,…
## $ valence <dbl> 0.5250, 0.7610, 0.3450, 0.1730, 0.3240, 0.5290,…
## $ tempo <dbl> 107.993, 99.988, 93.743, 136.977, 147.243, 131.…
## $ duration_ms <dbl> 264736, 280413, 318027, 258510, 160108, 235691,…
## $ time_signature <dbl> 4, 4, 4, 4, 4, 4, 4, 4, 4, 4, 4, 4, 4, 4, 4, 4,…
## $ key_mode <chr> "G minor", "G# major", "D major", "E minor", "C…The NYT piece highlighted 5 features that we can look at:
- Acousticness: likelihood the song features acoustic instruments
- Danceability: strength and regularity of the beat
- Energy: how fast and noisy the song sounds
- Loudness: the average volume of a song
- Valence: how cheerful the song sounds
These seem like a reasonable place to start. I’m not really sure how each track receives a given value for one of these features, or exactly what their increments mean. For 4 of the 5 features, it looks like they’re measured from 0 to 1, but loudness ranges from -36 to -1.34 in the tracks I’ve pulled out. Update: Spotify’s API has a page where these features are briefly described, and they helpfully include histograms for each of the numeric variables!
The NYT piece used spider/radar plots to show how individual songs have their own unique combination of the different audio features. I tried this approach out, but instead of putting the features on each of the points, I’ve placed the months there instead. For each month, I computed an average for each of the features. As you move clockwise around each ring, you can see whether average value for the songs of from that month were high or low. The dashed grey line is a visual reference. If the solid line is inside it, the month’s average was below what’s typical for songs in this collection. If the solid line is outside the dashed circle, the month’s average is above what’s typical.
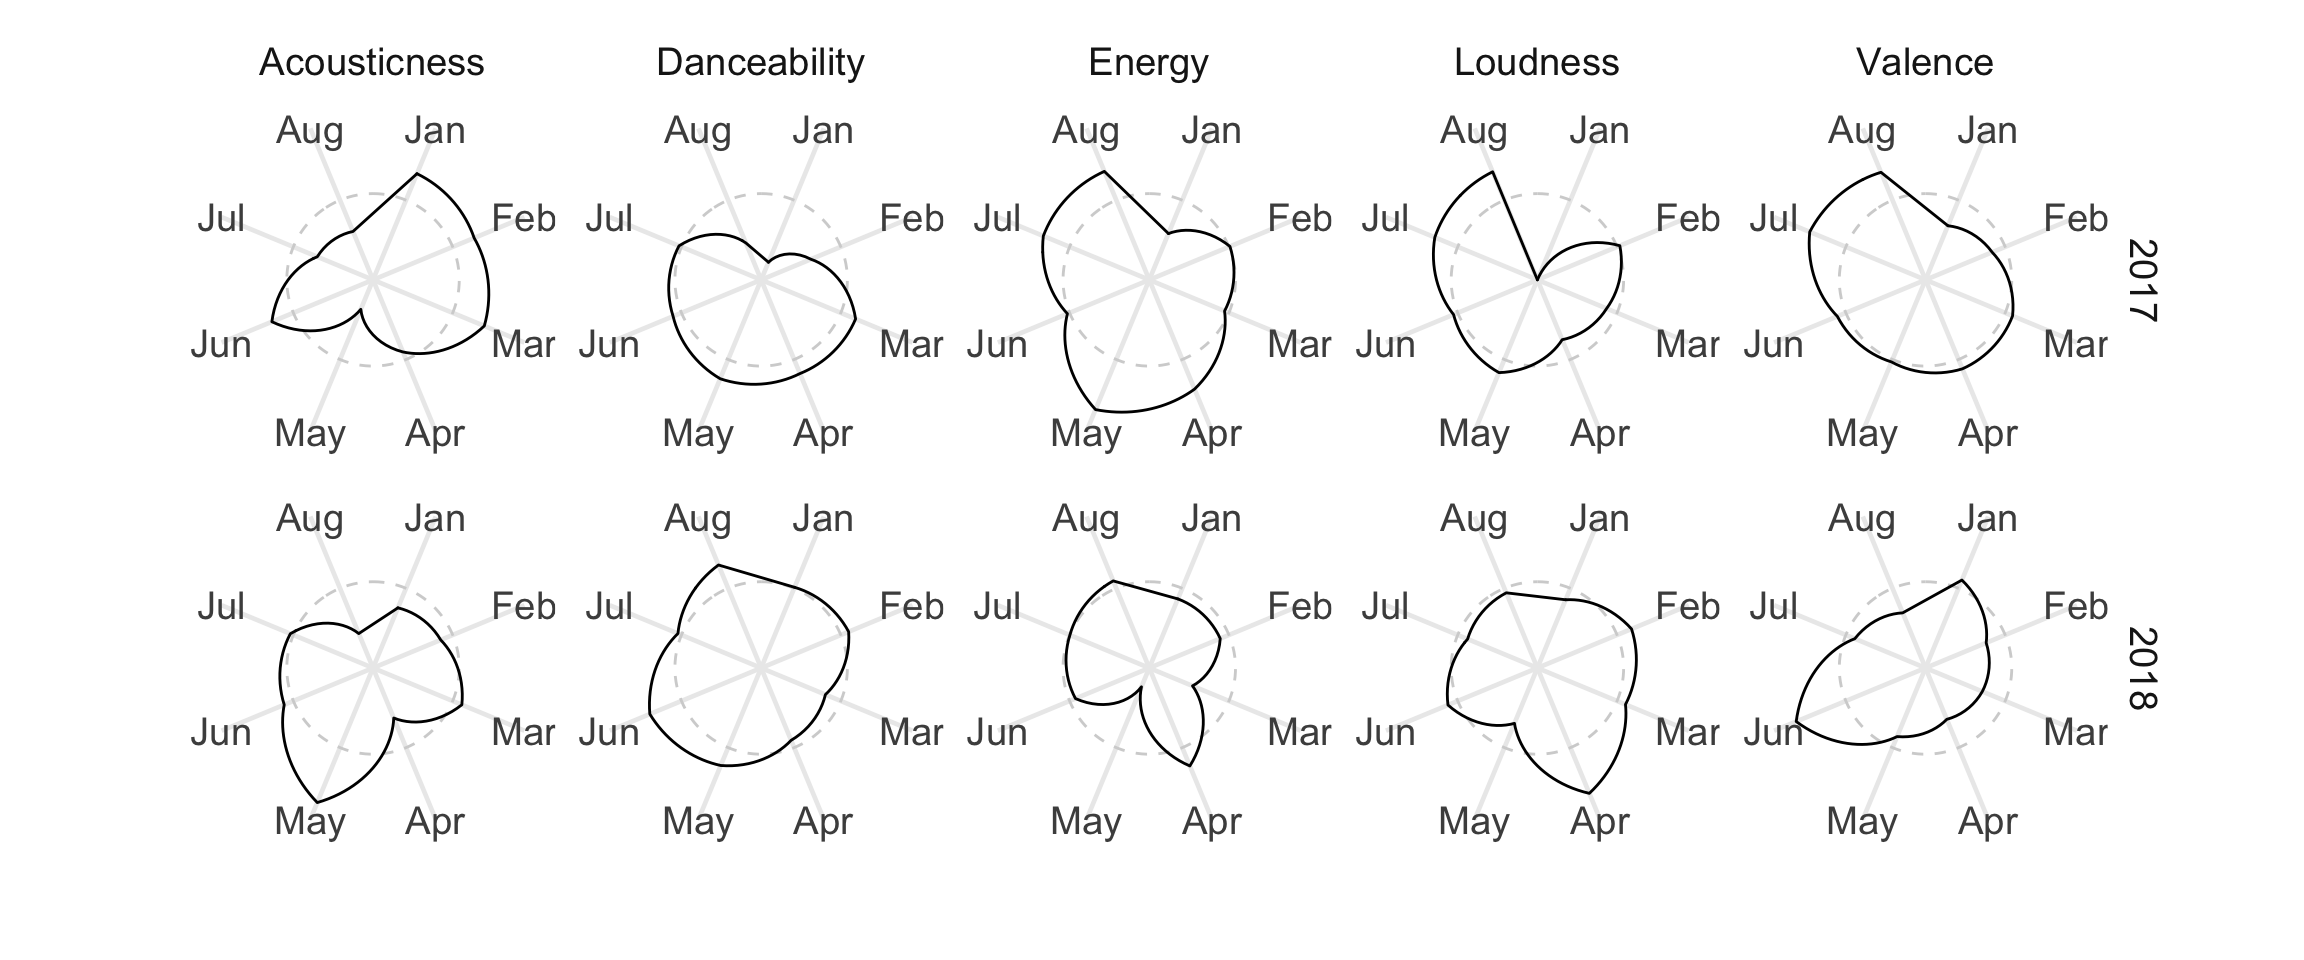
Although this style of plotting has some limitations, I really like how it highlights differences for comparison. If my listening habits were the same across both years, the shapes in each column would look the same. Let’s take energy as an example. In 2017 (top row), the line was above the reference during 4 of 8 months. To illustrate, here are two tracks, one from July (0.95) and one from August (0.93), respectively.
Contrast these to two tracks from May of this year. The first scoring at 0.18, and the other sitting closer to the middle at 0.35. Aside from breaking things apart by month, I don’t think I really have a system for deciding what goes on each playlist. I guess this May was sleepier than last year’s.
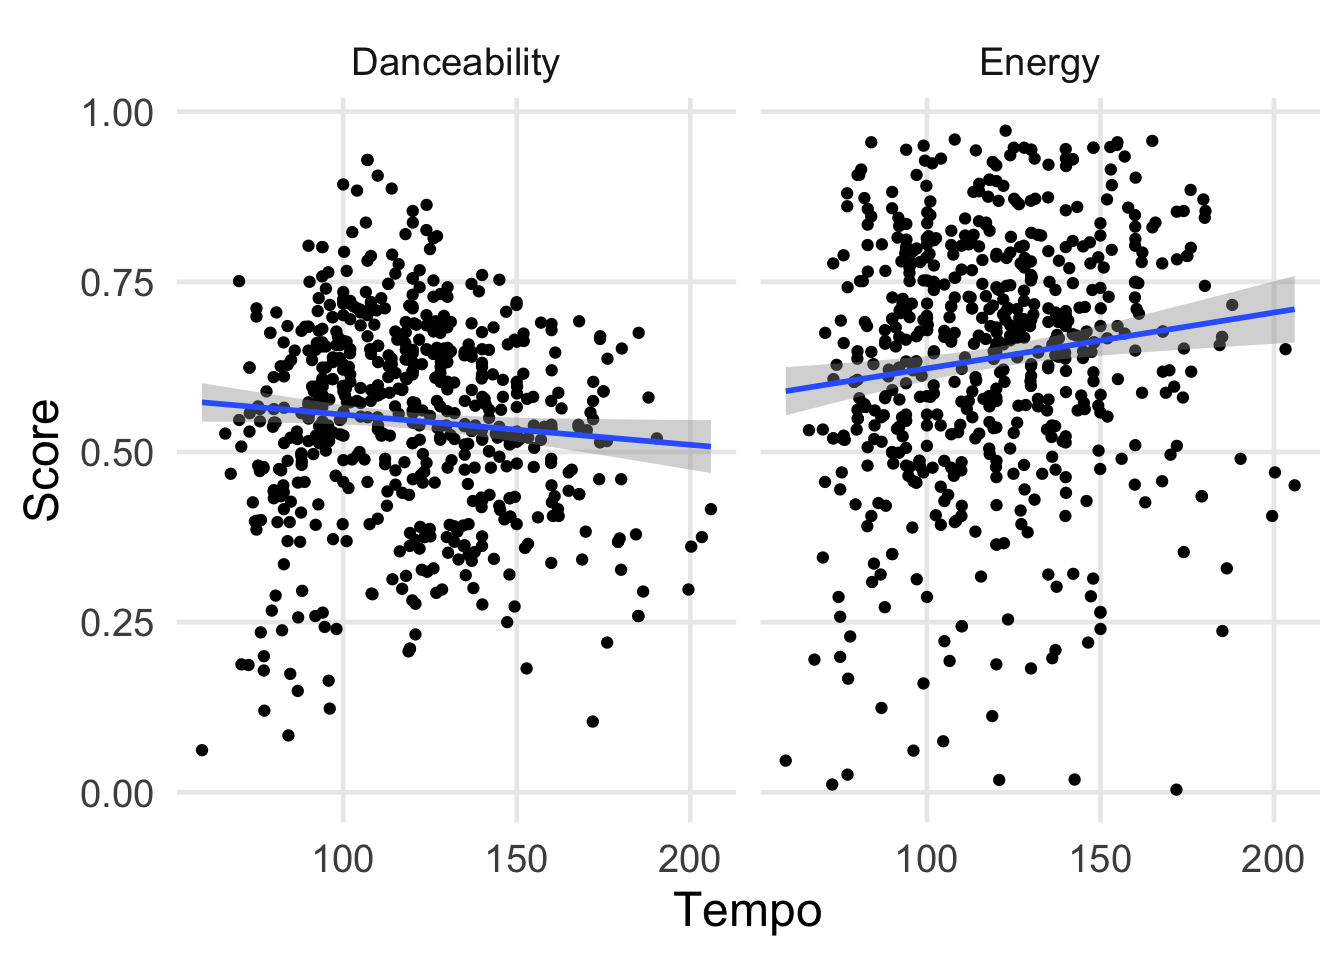
Based on these tracks and the description of Spotify’s features, I figured that energy or danceability would be pretty strongly related to tempo, but it doesn’t seem this is the case for tracks in my collection. The relationships are, um, noisy; maybe tempo should be transformed or rescaled somehow?
wrap-up
I think this is where I’m going to leave things for the moment. The main question I had going in was to see if there were any patterns in some of the features from month-to-month. Based on the brief progress here, it seems like there’s variation within and across years. I sort-of wondered if there would be any regular seasonal patterns, but maybe this isn’t really surprising. The universe of music I typically browse might have some overarching patterns that aren’t immediately clear from these features. At the same time, I only tried one summary, and there’s more metadata to be looked at. Perhaps there’s something to be learned in looking at how I go about adding tracks each day during a month. Time to let things sit for a bit, and revisit this data with some more specific questions.